Skip to content

P2Lab Stats for Shopware 6

Turn the Shopware admin into a BI workspace — reports, KPI widgets, cohort & RFM analysis, stock insights.

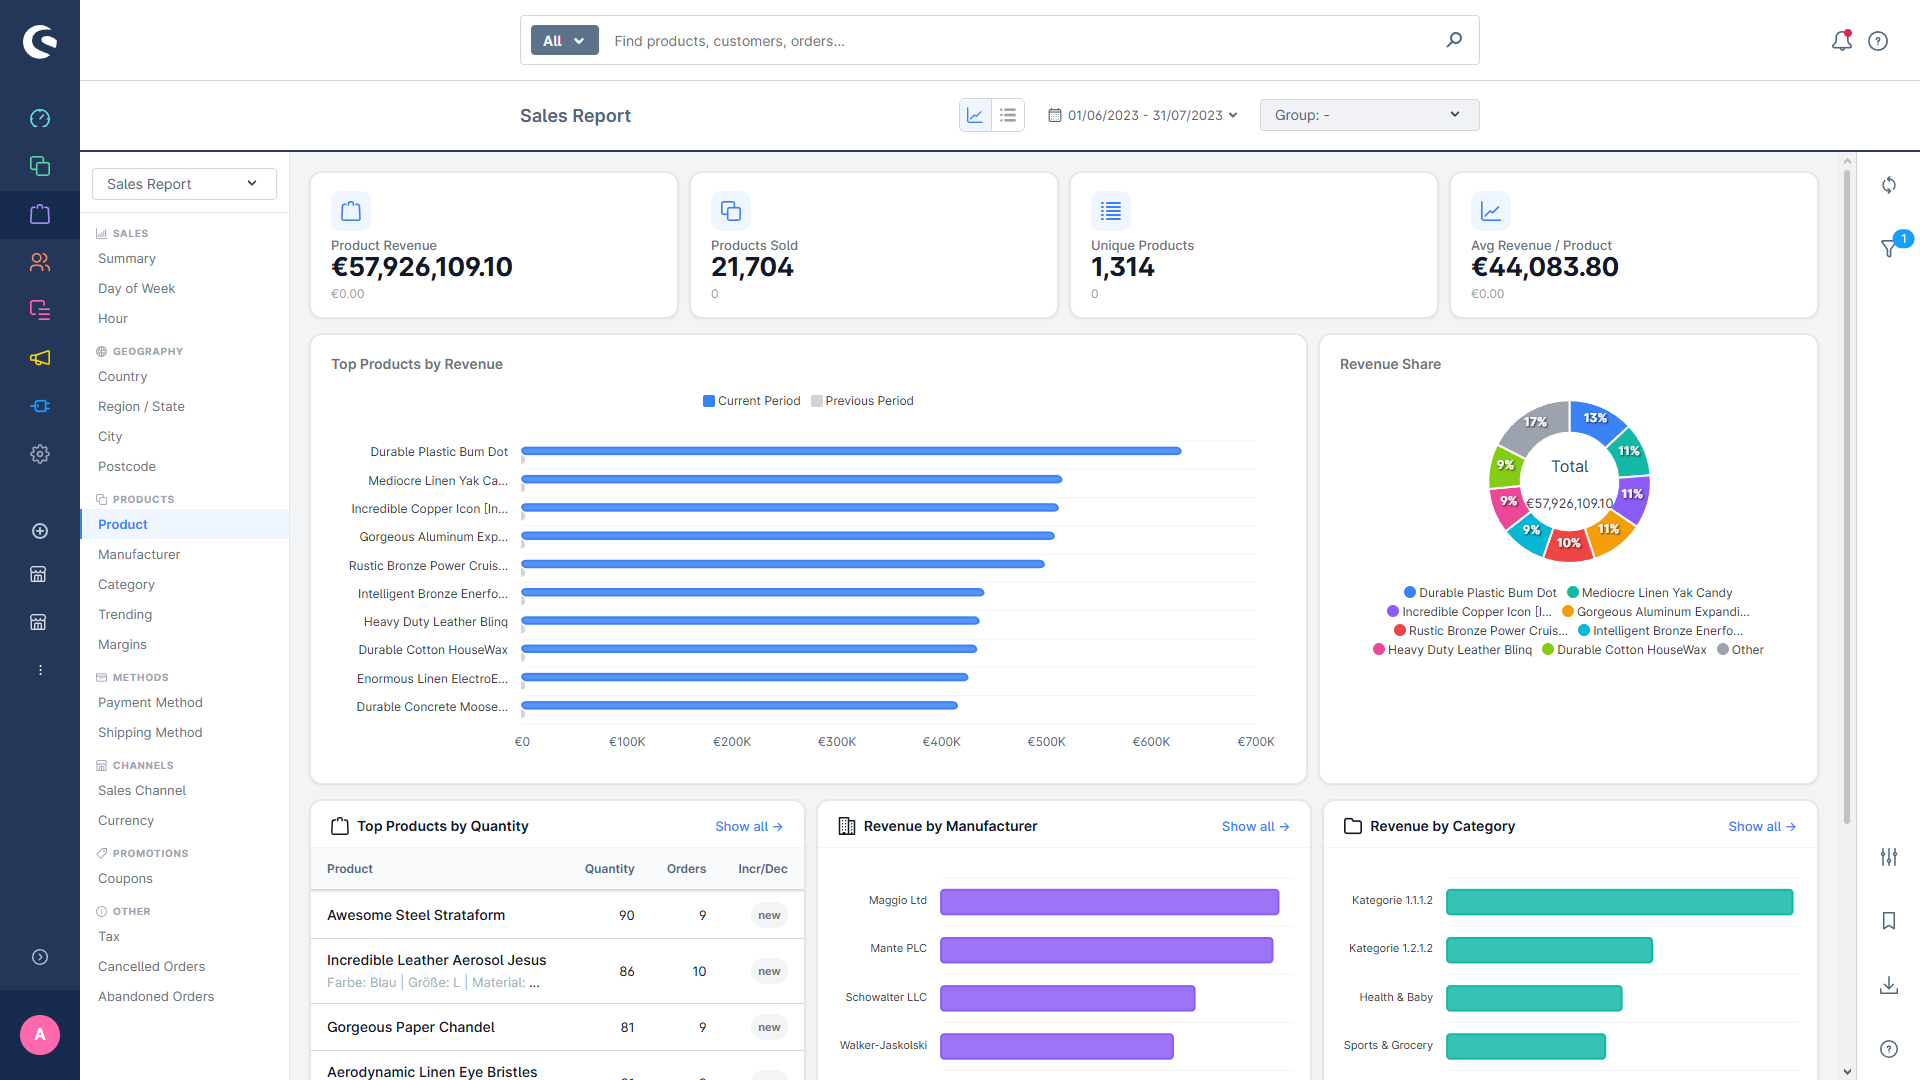
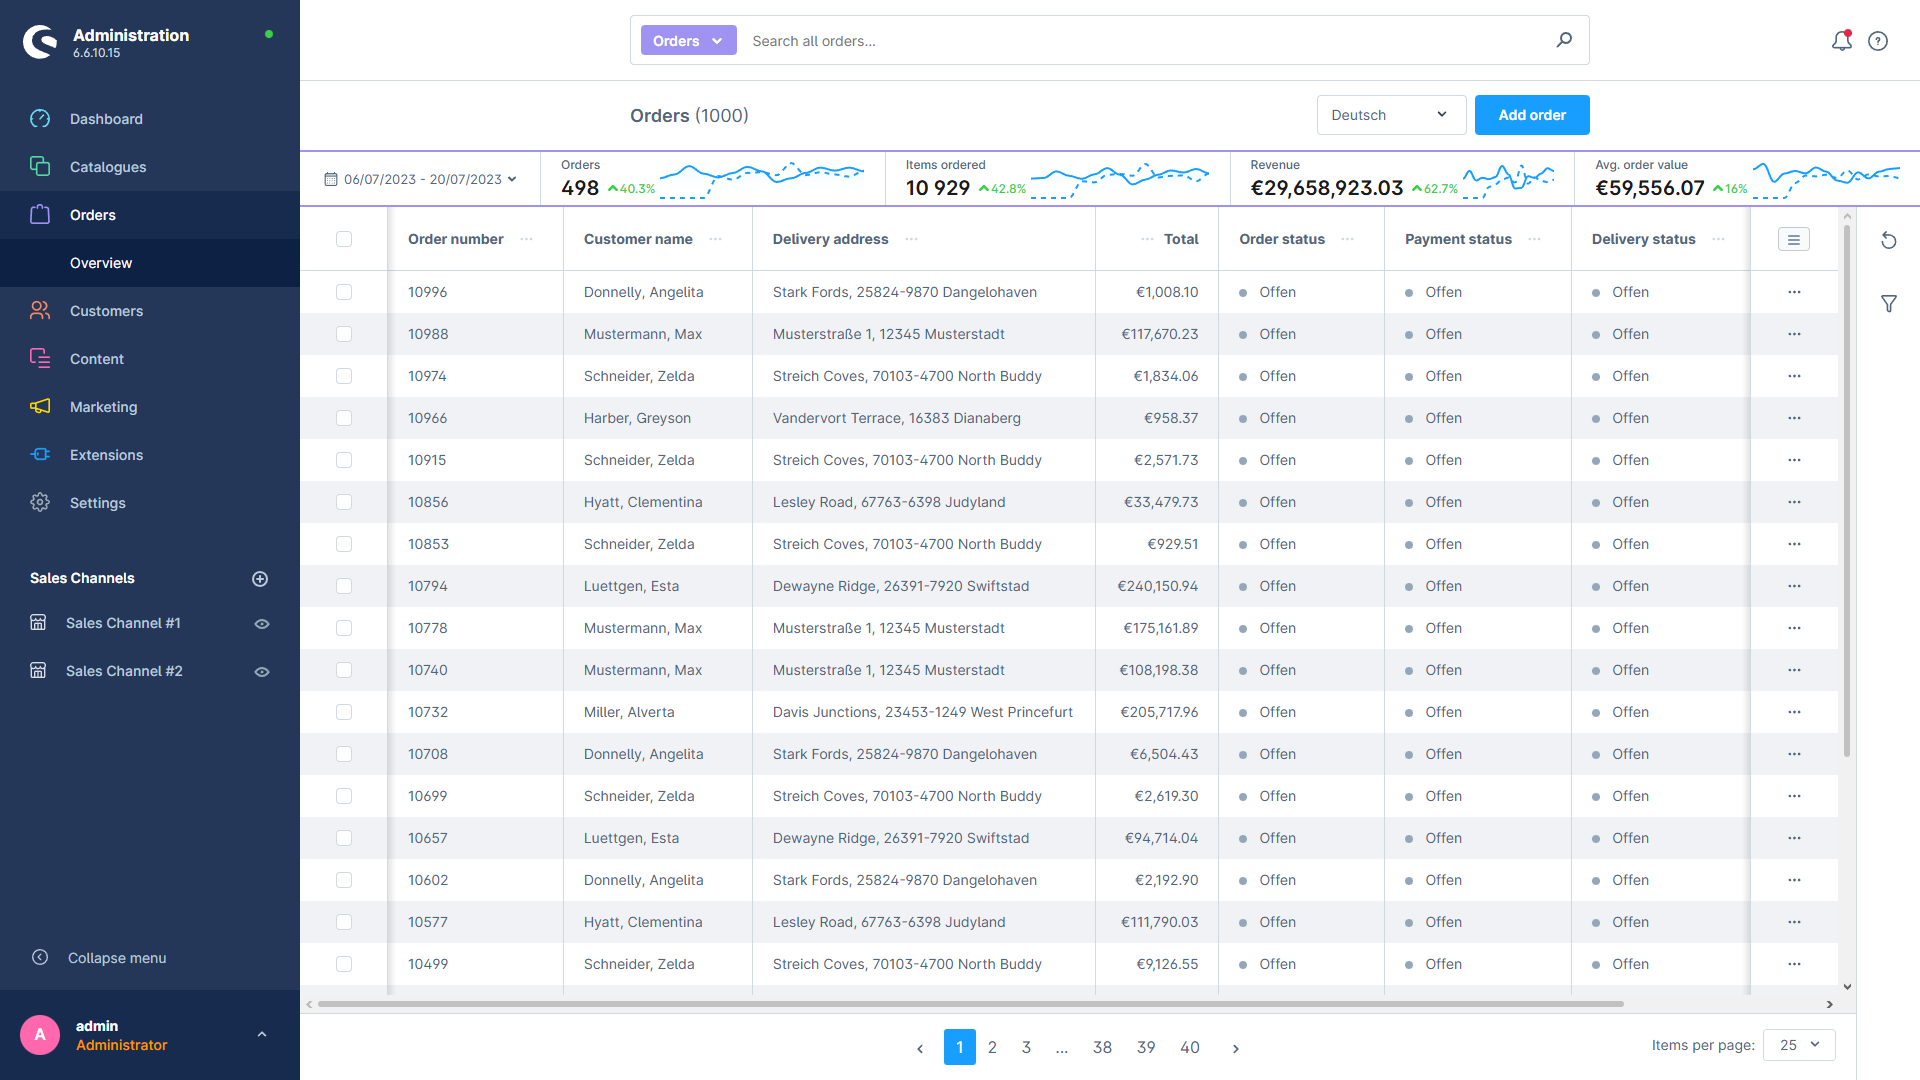
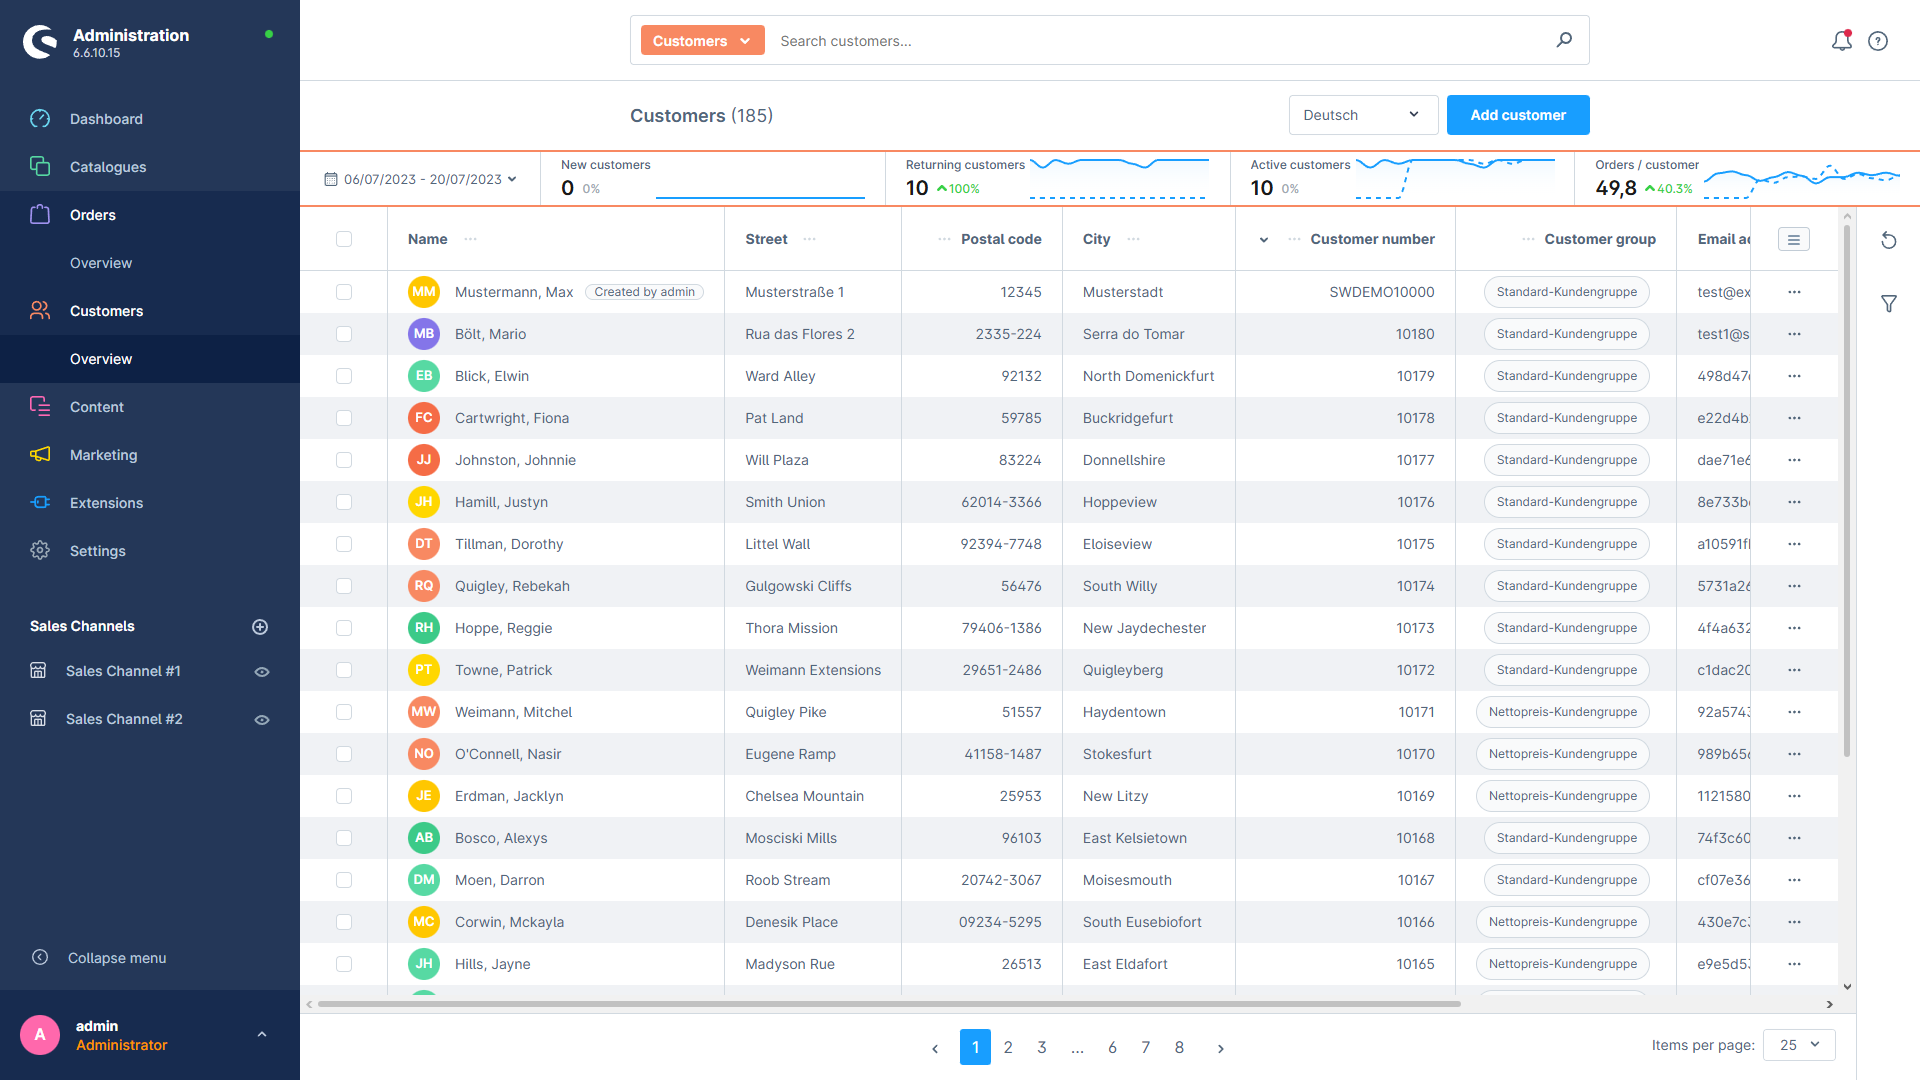
P2Lab Stats adds a complete analytics layer to your Shopware 6 admin. Two layers work together: instant KPI widgets embedded above the order and customer list pages, and a standalone P2Lab Stats module with in-depth reports across sales, customers, products and stock.

Sales reports

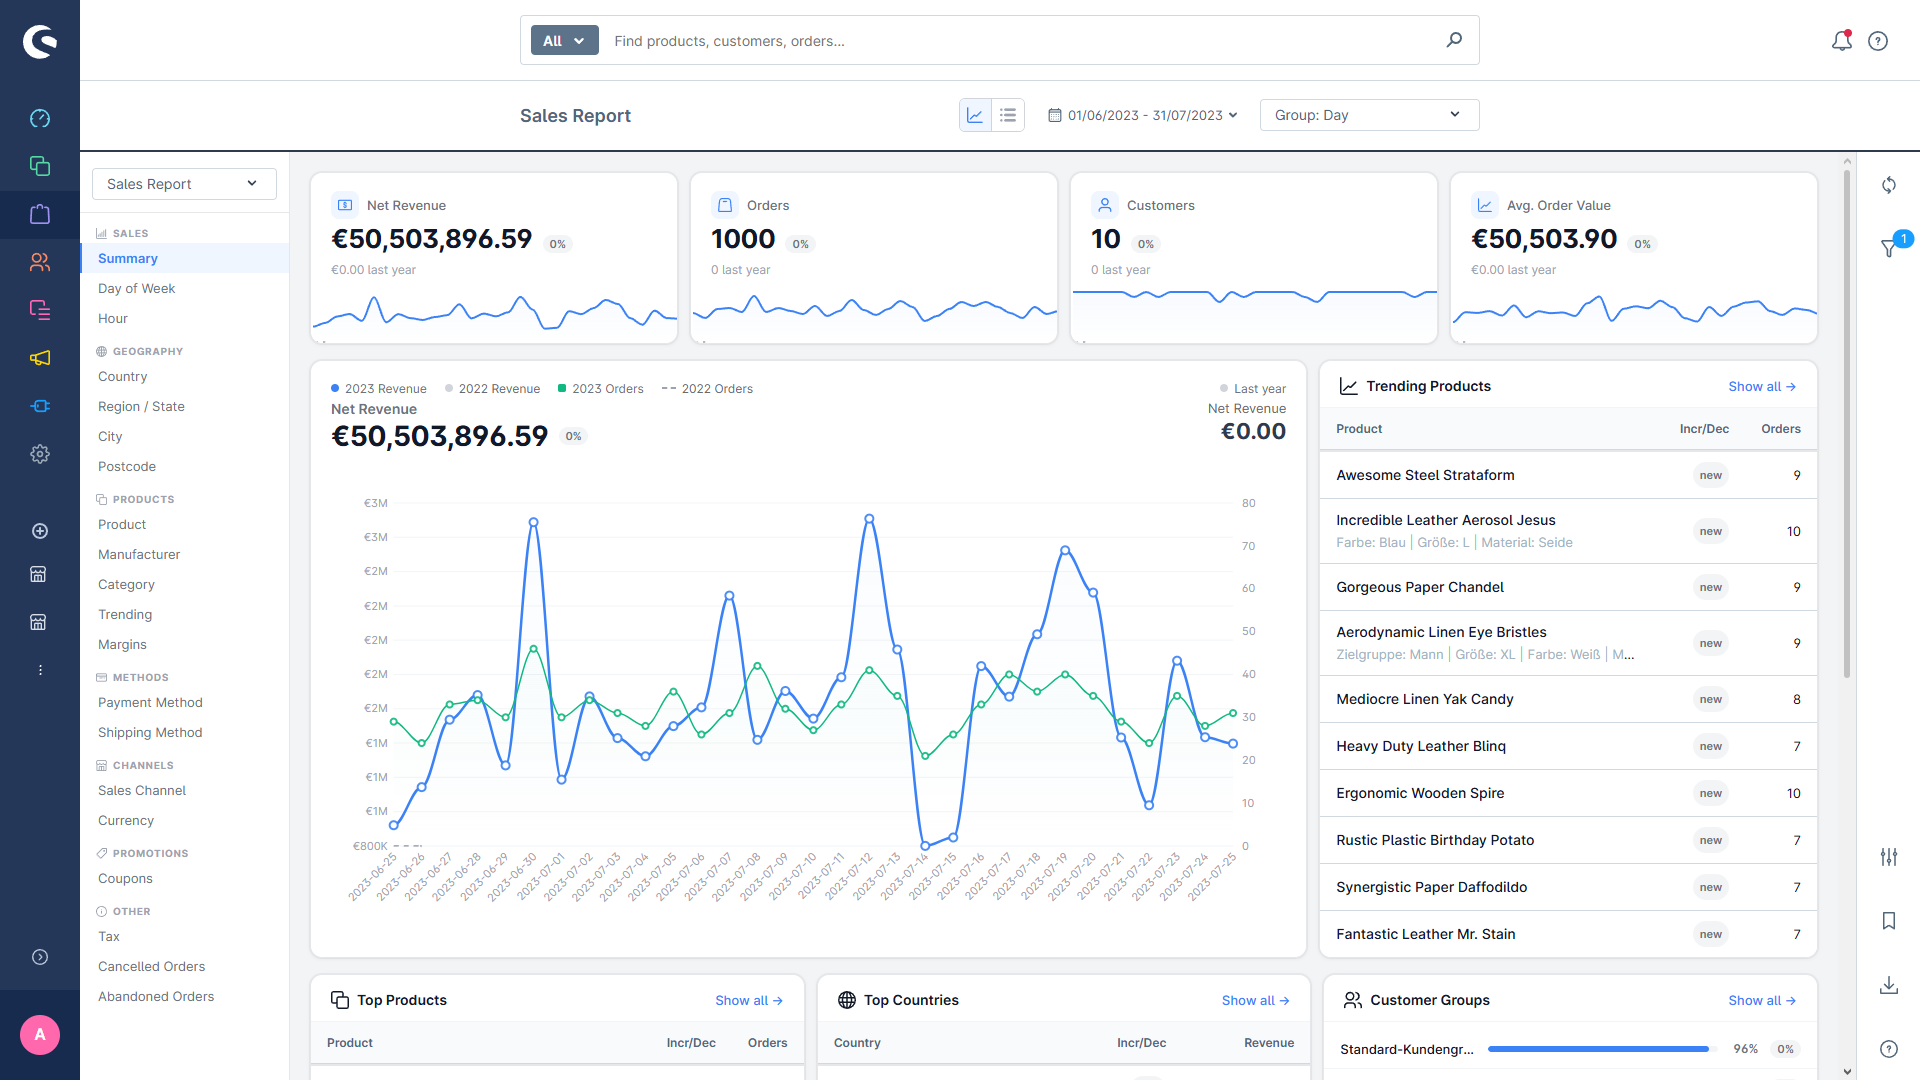
Revenue, orders, AOV and trends sliced by geography, time, catalogue, transaction and margins.
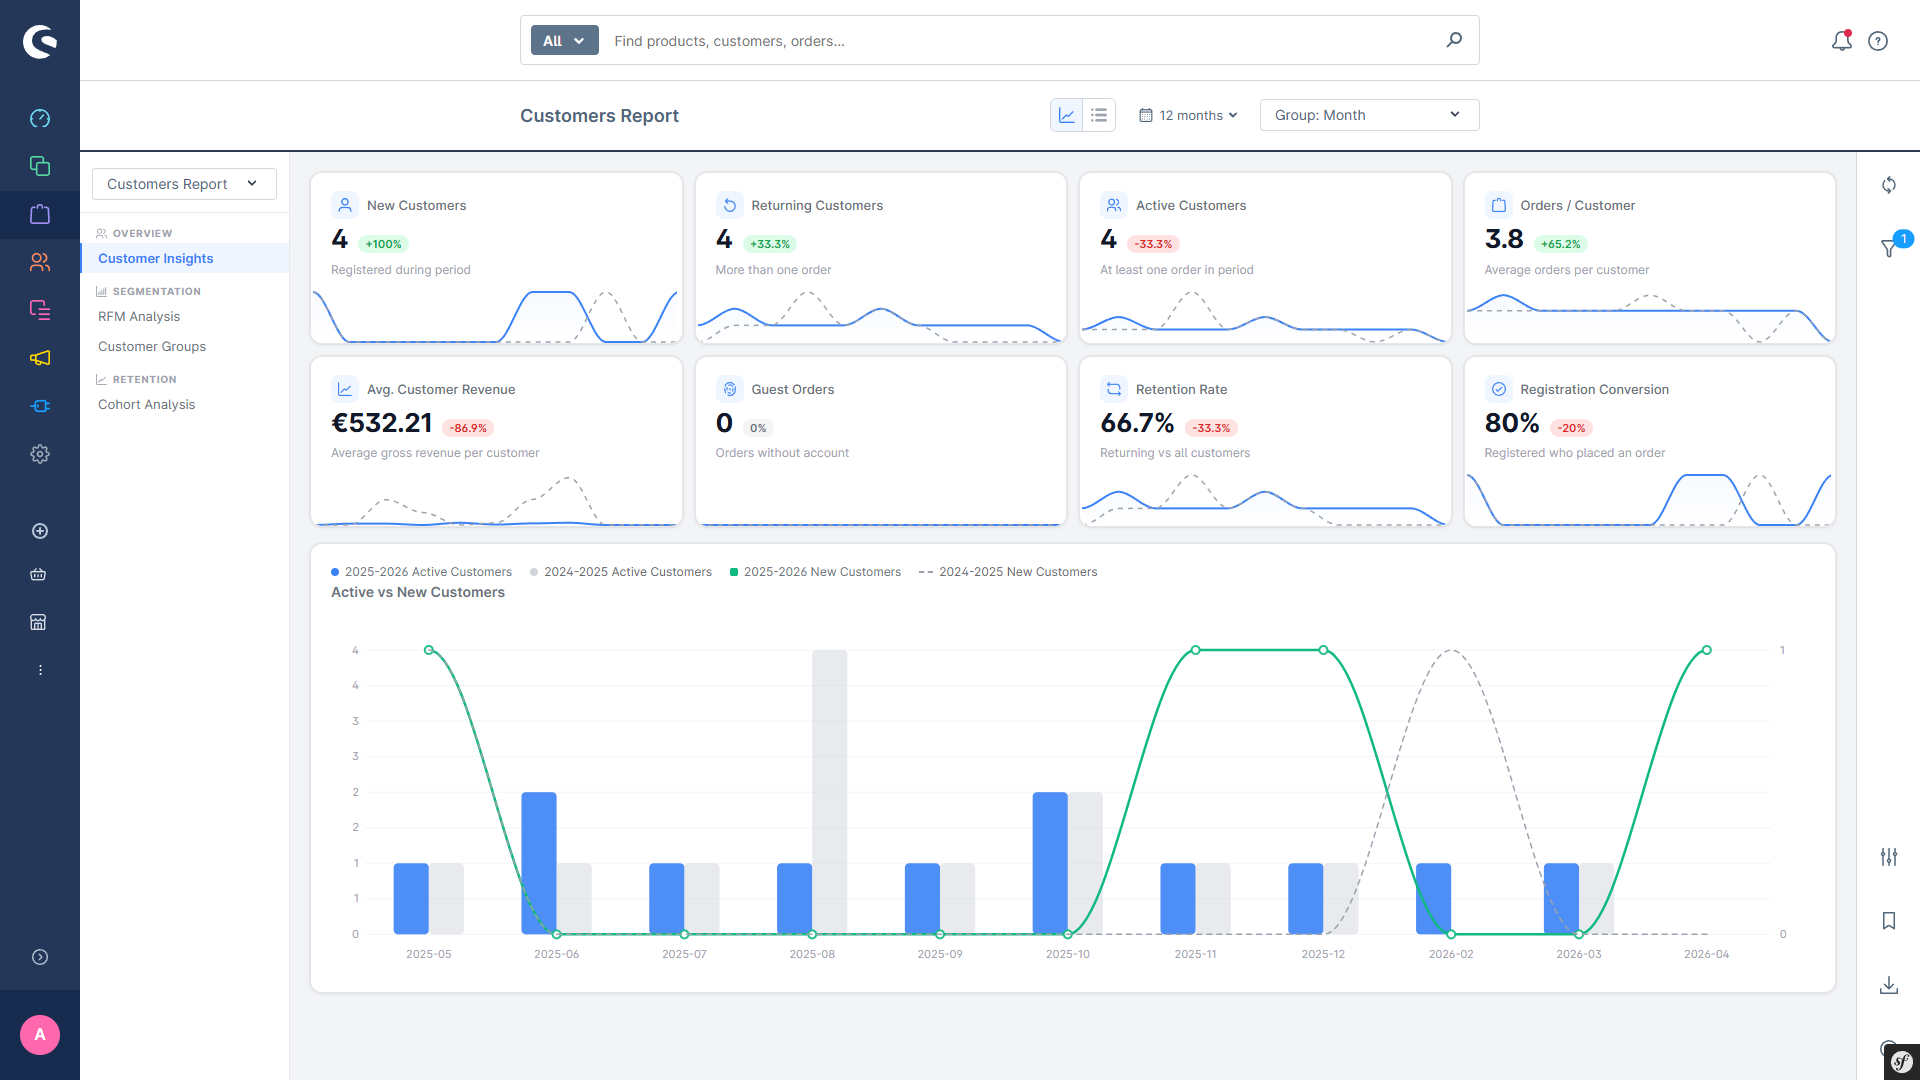
Customer reports

Cohort retention matrix, 10-segment RFM analysis, new-vs-returning customer overview.

Product & stock

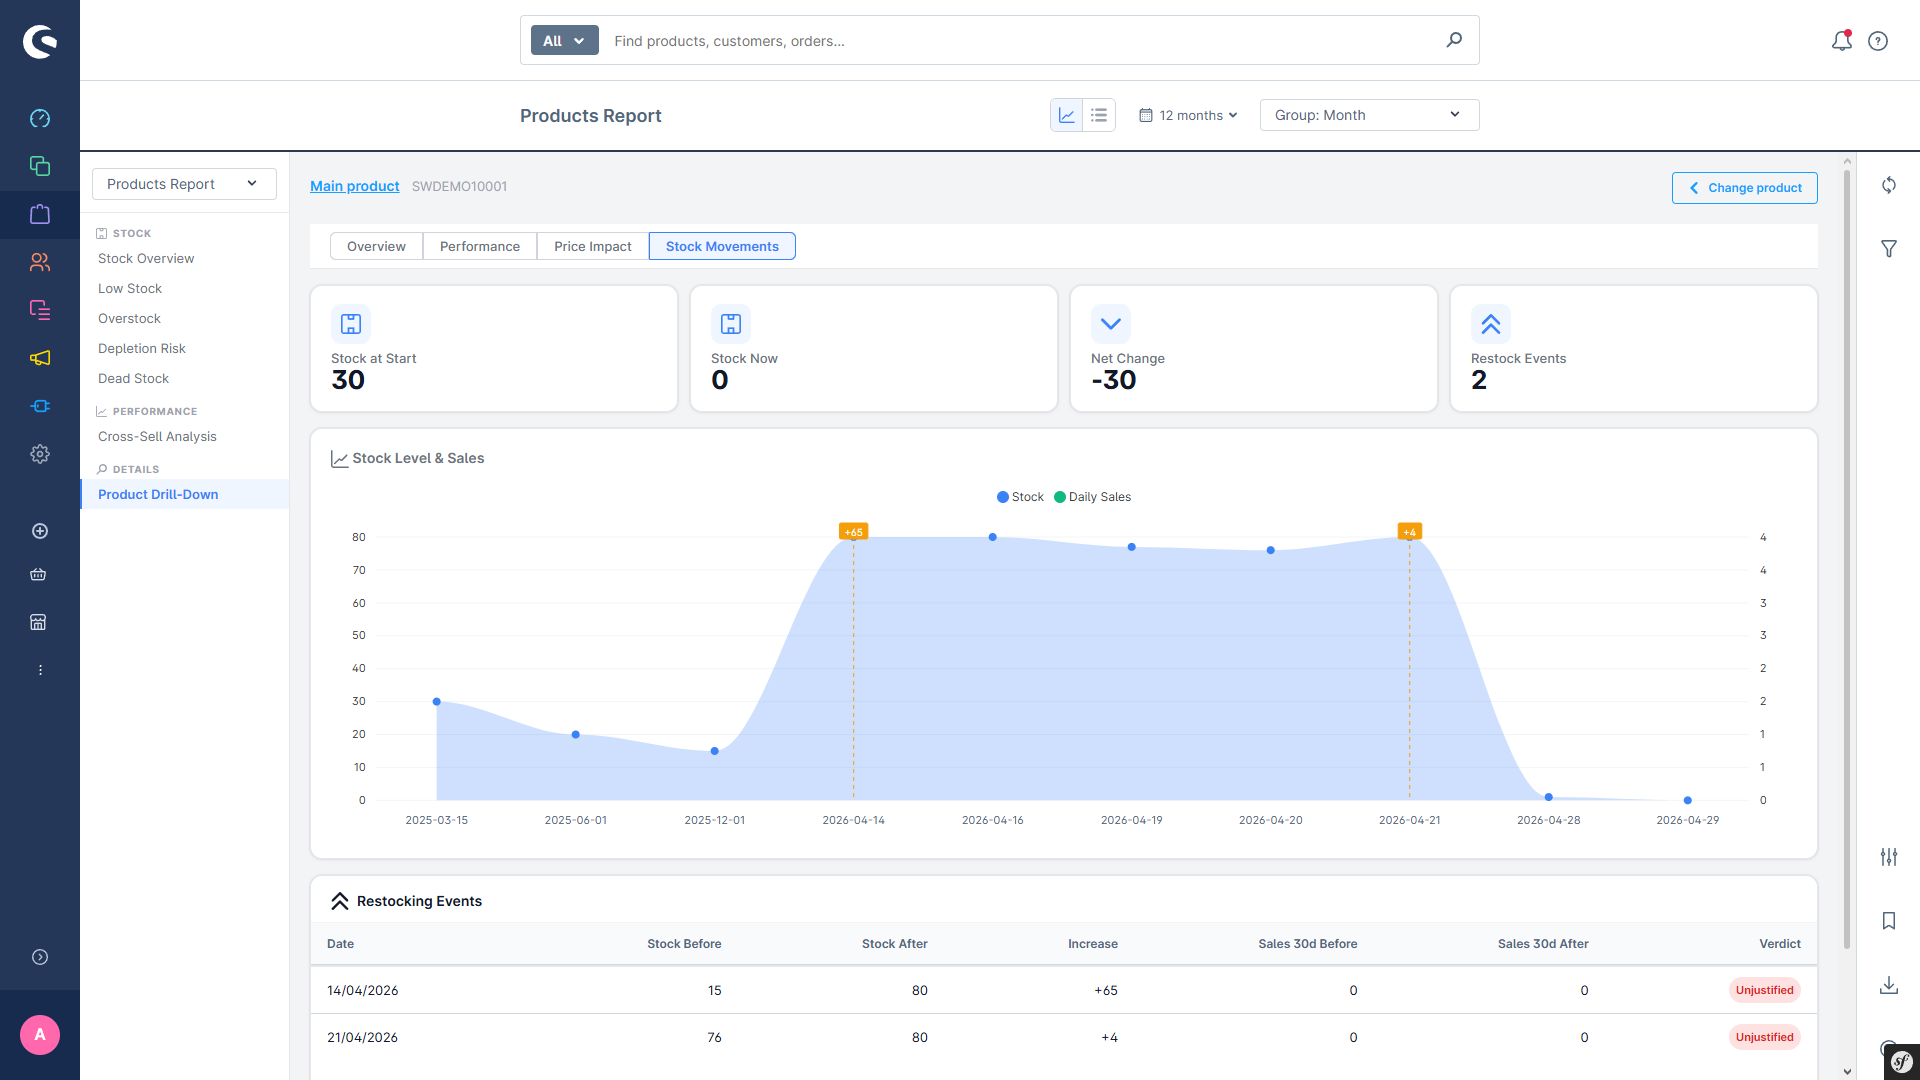
Stock overview, low-stock alerts, dead stock, overstock, depletion risk, cross-sell pairs and per-product drill-down.

KPI widgets

8 order KPIs and 8 customer KPIs (4 visible each) shown directly above the order and customer list.

  1. Install and activate the plugin in Extensions → My extensions.
  2. The P2Lab Stats module appears under the Orders menu with sub-pages for sales, customer and product reports.
  3. KPI widgets appear automatically above the order list (Orders → Overview) and customer list (Customers → Overview).
  4. Configure widgets, stock thresholds, cache warming and product snapshots under Settings → Plugins → P2Lab Stats.

Every report ships with the same chrome: chart at the top, sortable data table below, sidebar filter panel on the left, profile/refresh panel on the right. Filters and date range apply to chart, KPIs and table simultaneously.

  • Period comparison everywhere — every chart, KPI and table compares the selected range against the previous period of equal length.
  • 9 date presets plus a dual-month custom calendar — last 7/14/30 days, current/previous month, last 3/6/12 months, current year.
  • Saved profiles per report — store filter + sort + view-mode combinations and reload them with one click. Per-user and global defaults supported.
  • CSV / PDF export on every report, run as a background job with a progress modal.
  • Snapshot-based margin and stock history — daily product snapshots feed margin trends and depletion-risk forecasts.
  • Configurable cache warming — pre-compute reports off-peak for instant page loads.